I'm not feeling all too well but I didn't want to break my streak of writing. So today I'm writing about a non-Python related topic - Timeline Charts.
I was doing a profiling activity for work and I was scratching my head for a way to represent the info so as to explain it easily. Then I got to thinking, how does Google build all those charts to track page loads and API runtimes in Developer tools?
Turns out it's something called Timeline Charts that Google's made available for everyone.
Here's an example -
<html>
<head>
<script type="text/javascript" src="https://www.gstatic.com/charts/loader.js"></script>
<script type="text/javascript">
google.charts.load('current', {'packages':['timeline']});
google.charts.setOnLoadCallback(drawChart);
function drawChart() {
var container = document.getElementById('timeline');
var chart = new google.visualization.Timeline(container);
var dataTable = new google.visualization.DataTable();
dataTable.addColumn({ type: 'string', id: 'President' });
dataTable.addColumn({ type: 'date', id: 'Start' });
dataTable.addColumn({ type: 'date', id: 'End' });
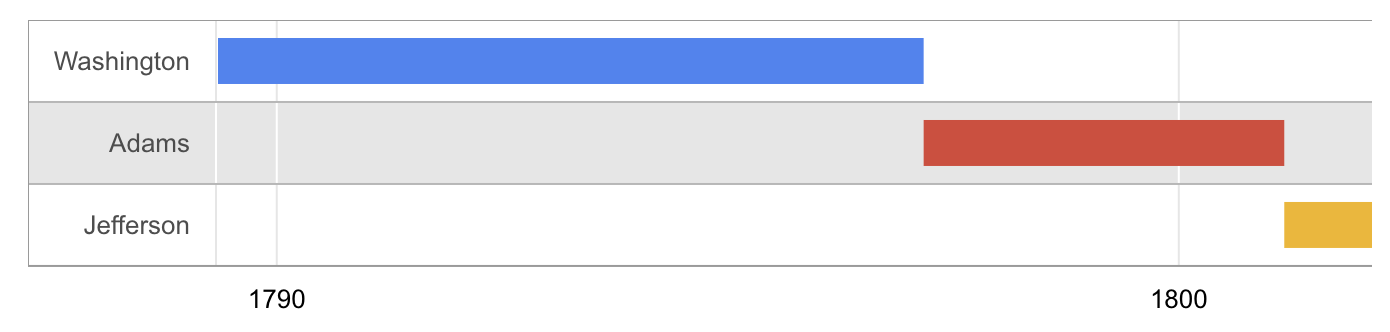
dataTable.addRows([
[ 'Washington', new Date(1789, 3, 30), new Date(1797, 2, 4) ],
[ 'Adams', new Date(1797, 2, 4), new Date(1801, 2, 4) ],
[ 'Jefferson', new Date(1801, 2, 4), new Date(1809, 2, 4) ]]);
chart.draw(dataTable);
}
</script>
</head>
<body>
<div id="timeline" style="height: 180px;"></div>
</body>
</html>
This results in a chart like -
This was a lot of fun to learn and ended up being a great way to present my work.
Will add details when I'm a little more energetic.