6th April 2024
I'm a big believer in melding programming with mathematics. It's a great way to learn both. Ed-tech aside, I think maths can be a lot of fun when you're able to see the results of your work in real-time.
If you're reading this, I don't think an introduction to the trigonometric functions is necessary. But if you're looking for a refresher, here's a quick one:
- sin, cos, and tan are the three primary trigonometric functions. They relate the angles of a right-angled triangle to the lengths of its sides.
- sin and cos are defined as the ratios of the lengths of the opposite and adjacent sides to the hypotenuse, respectively.
- tan, is the third of the primary trigonometric functions. With respect to an angle θ, it's the ratio of the length of the side opposite to θ to the length of the side adjacent to θ.
In this post, I'll demonstrate how to use Python to visualize trigonometric functions. The libraries we'll be using are:
numpyfor numerical operations/ trigonometric functionsplotlyfor plottingdashfor creating a web application
Sine function
The sine function is a periodic function that oscillates between -1 and 1. It is defined as: \(\sin(x) = \frac{opposite}{hypotenuse}\)
(Spoiler alert . The cosine function also oscillates between -1 and 1.)
Here's how we can plot the sine function using Python:
import numpy as np
x = np.linspace(-2 * np.pi, 2 * np.pi, 400)
y = np.sin(x)
Cosine function
The cosine function is defined as: \(\cos(x) = \frac{adjacent}{hypotenuse}\)
Plotting the cosine function using Python:
import numpy as np
x = np.linspace(-2 * np.pi, 2 * np.pi, 400)
y = np.cos(x)
Tangent function
Mathematically, the tangent function is defined as:
\[\tan(x) = \frac{opposite}{adjacent}\]Plotting the tangent function in Python:
import numpy as np
x = np.linspace(-2 * np.pi, 2 * np.pi, 400)
y = np.tan(x)
Plotting the functions using Dash - A Python web application framework
Dash is a Python web application framework that allows you to create interactive web applications using Python. It's built on top of Flask, Plotly, and React.js, and it's designed to make it easy to create web applications with complex interactive visualizations.
Its installation is simple:
pip install dash plotly
Here's how we can use Dash to plot the 3 trigonometric functions:
import dash
from dash import dcc, html
from dash.dependencies import Input, Output
import plotly.graph_objs as go
import numpy as np

app = dash.Dash(__name__)

app.layout = html.Div([
    html.H1("Interactive Trigonometric Functions"),
    dcc.Dropdown(
        id='function-dropdown',
        options=[
            {'label': 'Sine', 'value': 'sin'},
            {'label': 'Cosine', 'value': 'cos'},
            {'label': 'Tangent', 'value': 'tan'}
        ],
        value='sin'  # Default value
    ),
    dcc.Graph(id='trig-graph')
])

@app.callback(
    Output('trig-graph', 'figure'),
    [Input('function-dropdown', 'value')]
)
def update_graph(selected_function):
    # Updated range for x
    x_left = np.linspace(-np.pi, 0, 200)  # From -pi to 0
    x_right = np.linspace(0, np.pi, 200)  # From 0 to pi
    x = np.concatenate([x_left, x_right])  # Combine for full range

    if selected_function == 'sin':
        y = np.sin(x)
    elif selected_function == 'cos':
        y = np.cos(x)
    else:  # Assuming 'tan'
        y = np.tan(x)
        y[np.abs(y) > 10] = np.nan  # Avoid displaying very high values to handle vertical asymptotes

    figure = {
        'data': [go.Scatter(x=x, y=y, mode='lines')],
        'layout': go.Layout(
            title=f'{selected_function.upper()} Function',
            xaxis={'title': 'X', 'tickvals': [-np.pi, -np.pi/2, 0, np.pi/2, np.pi],
                    'ticktext': ['-π', '-π/2', '0', 'π/2', 'π']},
            yaxis={'title': 'Y'},
            hovermode='closest'
        )
    }
    return figure

if __name__ == '__main__':
    app.run_server(debug=True)
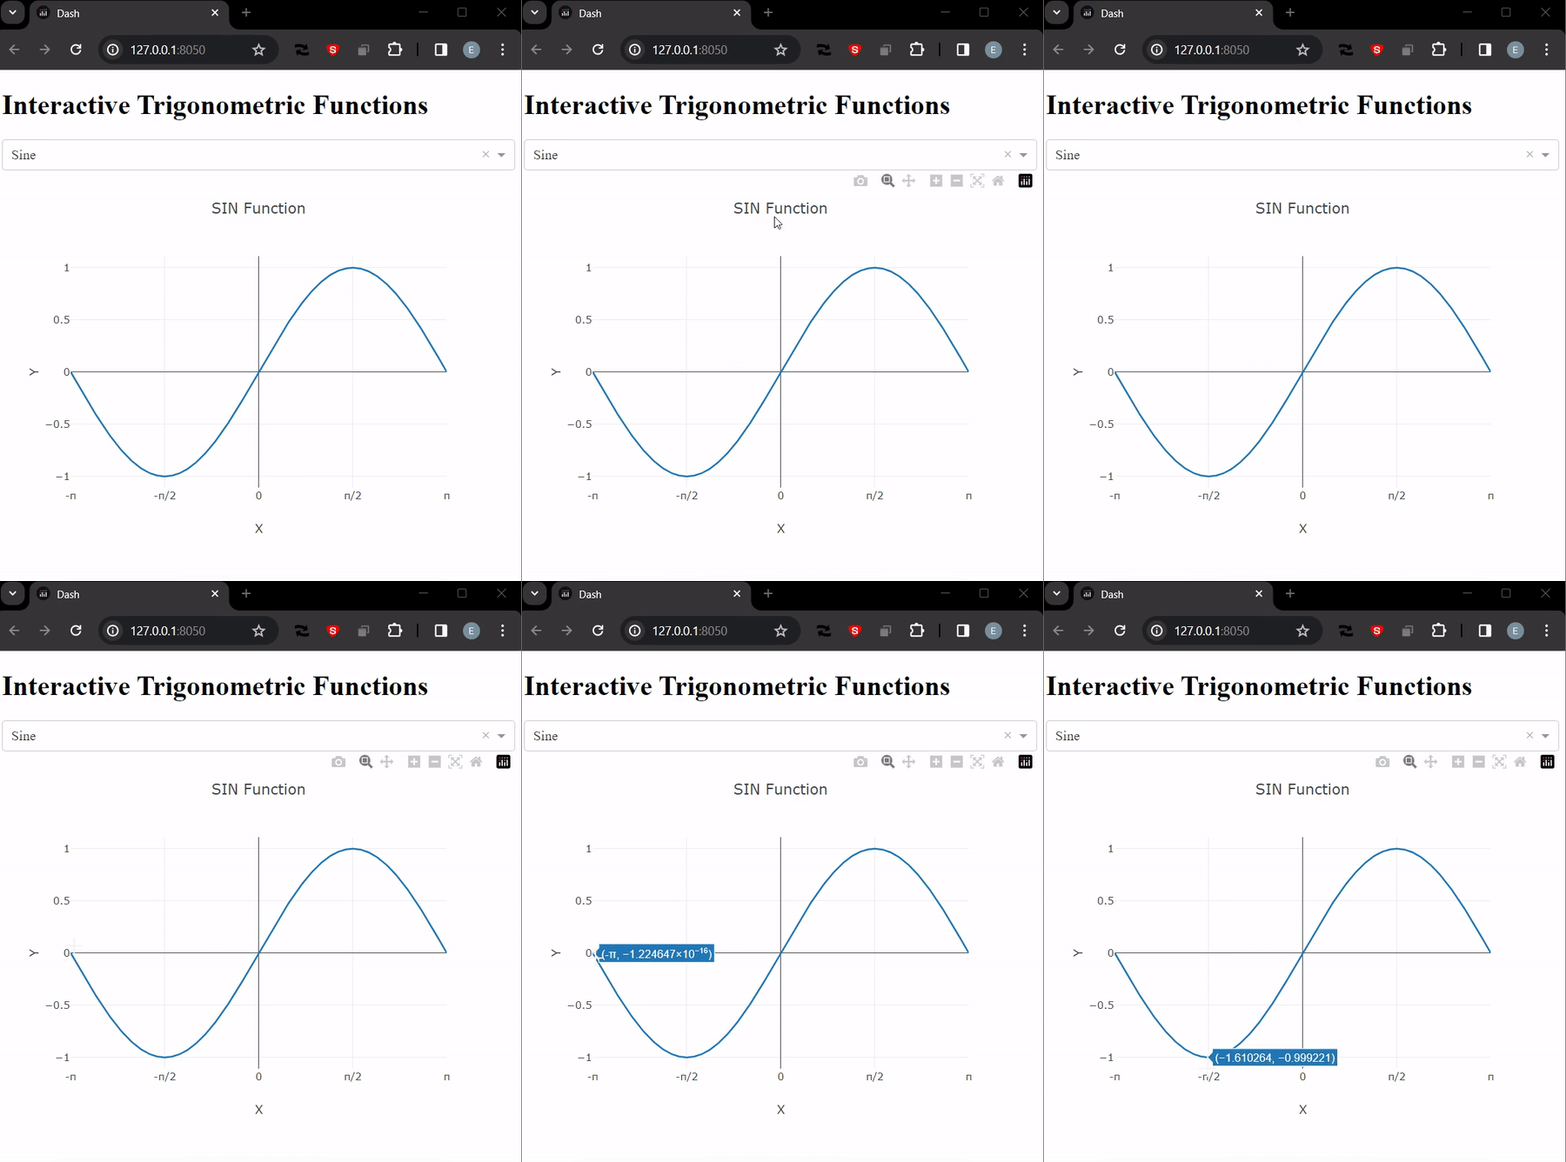
Here's the result -
